Nerd Out with GDB
June 24th, 2005Most of us stick to IDE debugging as much as possible. The visual layout of the source listing, variables, and stack available at all times and constantly updated is too convenient to overlook.
But sometimes it’s better to engage in direct dialog with a command line debugger – in my case, GDB. Perhaps, as you’re stepping through your handiwork in Xcode, you realize you need to display some piece of data in a much more specific manner than Xcode’s default displays will allow. Or you spot a rogue process on your system and decide to attach with GDB just to see what’s going on before pulling the plug on it. Or, if you’re like me, maybe you just want to figure out what makes a program tick.
As a curious programmer, I often find myself cruising through assembly code for which I have no source code guidance. In these instances, Xcode’s IDE wrapper offers few advantages, and it can be a hassle to convince it to target an arbitary process.
The Problem: GDB is hard!
Unfortunately, GDB is no Mac app. The opposite of intuitive, GDB is to debugging as vi is to word processing. I know about as much about GDB as I do about vi: I can get some things done and impress some of my co-workers, but am by no means an expert. As non-experts, we tend to do whatever we must to “get by.” In GDB this means learning a few basic commands: step in, step over, break, temporary break (ooh! you didn’t know about that one?), etc.
At some point in my naive yet adventurous approach to using GDB, I decided I was spending way too much time repeating this pattern:
- Disassemble some code (x/20i $pc)
- Look for point of interest – a branch, subroutine call, etc.
- Squint at display and try to read the hex address corresponding to point of interest.
- Step over instructions until I get to the point of interest (GDB knights say “ni“)
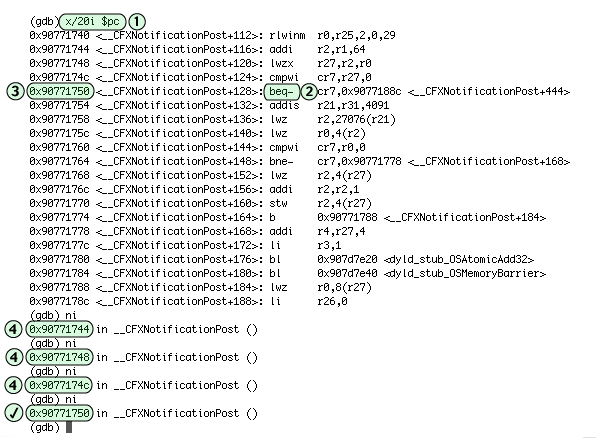
This pattern is not too terrible for short instruction runs, but it’s error-prone and gets tedious when you’ve got to step over 10 or 20 instructions to reach your destination, nervously repeating step 1 to make sure you didn’t zip past the point of interest.
The pattern is slightly improved by taking advantage of GDB’s temporary breakpoints. If you can see the address you wish to be at, and stepping through the instructions from here to there looks like it will be tedious, a temporary breakpoint can get you there quickly and accurately. My previous pattern revised to take advantage of temporary breakpoints looks something like this:
- Disassemble some code (x/20i $pc)
- Look for point of interest – a branch, subroutine call, etc.
- Squint at display and try to read the hex address corresponding to point of interest.
- Set a temporary breakpoint for the target address. (tb *0x90771750)
- Continue execution and hope I didn’t make a mistake. (c)
Now the steps are at least reduced from to a known quantity. Quite an improvement, but still tedious and (most importantly) error-prone! I’m using a computer, here. Throw me a bone! If I can perform these steps with some level of agility and grace, can’t the computer do it for me even better?
The Solution: GDB can be Automated!
After months of struggling with this question, I finally decided to dive in and find out. Doing or learning anything new with GDB is intimidating: now I know why I waited so long! “Help” gives you about 12 categories of help, all of which are vague and point to no clear solution. What I am envisioning sounds like it might be covered by any of these categories: breakpoints, data, obscure, running, status, support, user-defined.
I decide to approach the problem in a brute-force manner. (I’m sure somebody reading this will chime in with the easy, built-in solution. Story of my life!) If I can look ahead and squint my eyes at instructions as they scroll down the page, certainly GDB can do it!
At this point I spend far too much time figuring out preliminary things. I’ll spare you the details but the outline goes something like this:
- How do I define a macro in GDB? I mean really define a macro, with arguments, multi-line logic, etc. This is a fun story, filled with plot twists and death-defying stunts. You should learn how to hack with GDB macros, but for the purposes of this article, just copy my code!
- Can I examine memory from the macro? It turns out to be really easy, since GDB uses C-like syntax for most of its interactions with the user, and this syntax is all perfectly legal inside macros.
- What makes a piece of memory look like a “point of interest?” Basically, it’s any function call, fork in the road, or the end of the function I’m cruising through. Since these are all implemented as PowerPC branch instructions, there is a tedious but reliable set of rules that they must follow. [an Intel based version of this nerd-out is not available at this time!].
Answering the above questions gave me sufficient material to come up with the following GDB macro, which I hope you’ll find useful. To make it available in your gdb sessions, simply copy and paste the text into a file named “.gdbinit” in your home directory.
define np
# start at the instruction after this
set $peek=$pc+4
set $found=0

# define the number of bytes we'll scan before giving up
set $bignum = $peek+1000
        while (($found==0) && ($peek < $bignum))
                # Test the value at this location. Does it look
                # like a well-known point of interest?

                # or a blr, or btctr instruction?
                if ((*$peek == 0x4e800020) || (*$peek == 0x4e800420))
                        echo Found end of routine\n
                        set $found=1
                end

                # is it a branch routine or system call instruction
                # of any other kind?
                # 16 - branch conditional
                # 17 - system call
                # 18 - branch
                # 19 - branch conditional to link or count register

                # Opcode is highest 6 bits of instruction
                set $opcode = ((*$peek & 0xFF000000) >> 26)
                if (($opcode >= 16) && ($opcode <= 19))
                        echo Found branch\n
                        set $found=1
                end

                # if we didn't find anything, advance to the next instruction
                if ($found == 0)
                        set $peek=$peek+4
                end
        end
        if ($found == 1)
                # set a temporary breakpoint at the point of interest,
                # and resume execution of the program.
                tb *$peek
                c
        end
        if ($found == 0)
                echo Point of interest not found.\n
        end
end

document np
Search memory for a "point of interest" instruction, starting one instruction
after the current PC and advancing directly forward until a qualified
instruction is found, or an arbitrary (1000) number of instructions has been
examined. If found, a temporary breakpoint is set at the subroutine call point,
and execution is continued. A "point of interest" is any PowerPC branch
instruction or system call.
end
So what has this gained me? Continuing with the same example debugging session, my “steps to completion” is now down to a breezy three, and the risk of error is greatly diminished:
- Disassemble some code, just to get oriented. (x/20i $pc)
- Look for a point of interest (or don’t look, it doesn’t really matter).
- Invoke my handy new macro! (np)

At this point I’m free to carry on with my debugging however I please. Usually, it means stepping over the branch, again getting a lay of the land, and invoking my macro again.
Obviously, there is a lot of tedious work involved when using GDB, even with the help of automated processes like this. But until the next link in the chain becomes so tedious that I can’t bear it, I’m happy with my new workflow. I hope this article inspires you to get more out of GDB and your other development tools, and don’t settle for tedium!


June 24th, 2005 at 10:36 pm
Nice hack, I never thought of this approach :)
One can also say “disp/i $pc” to make gdb always print the next instruction – then, it’s easy to spot points of interest while single-stepping.
August 6th, 2005 at 3:25 pm
You _desperately_ need to check out the contents of /usr/libexec/gdb/plugins/MacsBug/. I’ve got that plugin loading in my .gdbinit and it makes ASM debugging much, much nicer. I don’t use the MacsBug window mode, I just let it show me registers and the next few lines of ASM.
April 3rd, 2007 at 1:26 pm
All I wanted to do was be able to execute two gdb commands. I didn’t know gdb had macros. Great example.